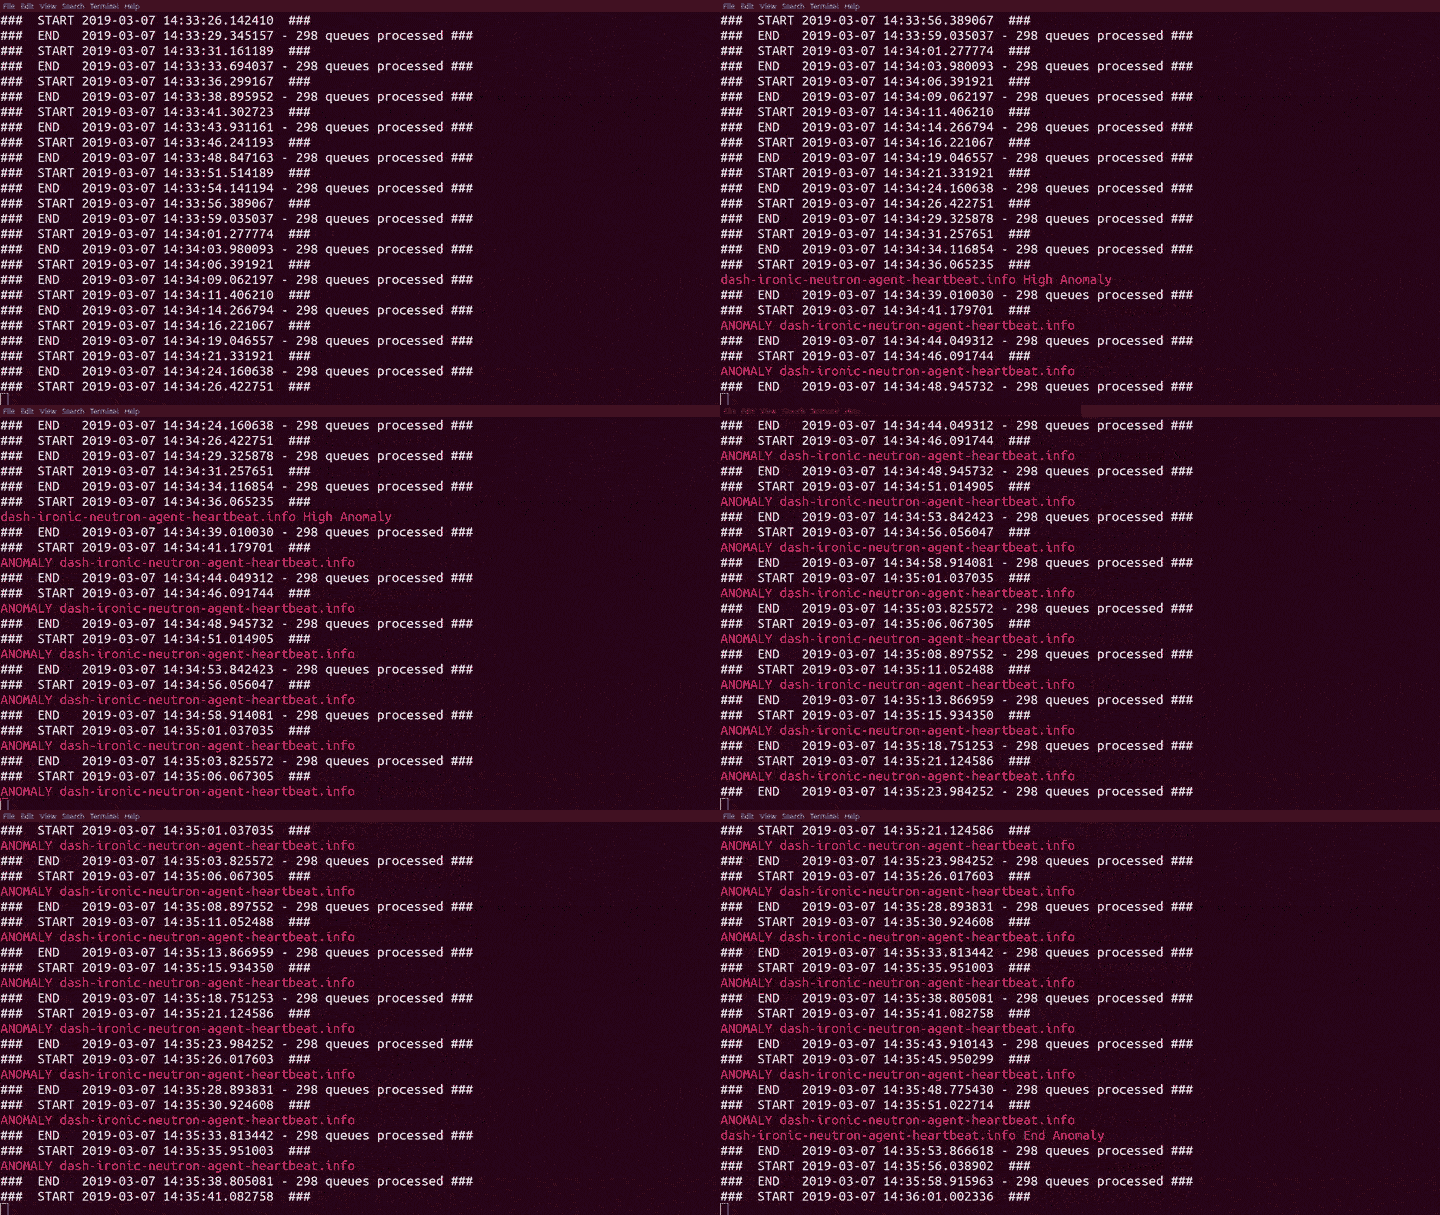
It has been an interesting week. Without any fanfare, I quietly introduced our Machine Learning code to the production RabbitMQ cluster for the first time. Hoping to improve our ability to detect problems with our internal OpenStack deployment, and without checking the state first, I nearly fell off my chair when it found the first real anomaly after only 50 seconds!

A little background is in order. Much has been written about the capabilities of Machine Learning in many exciting fields, from image categorization and natural language processing to game theory. A slightly less flashy and mundane use is detecting anomalies in streams of data. This happens to be very useful for complex systems like Software Defined Networks and OpenStack where telemetry is abundant, but often in too great a quantity for easy use, or too complex to write simple threshold-based monitoring rules for.
We’ve spent the last few months working with Machine Learning technology, using open source switch telemetry data sets to prove out the anomaly detection concept in our areas of expertise, then leveraging a second type of ML to automatically categorize and fix issues in a controlled lab environment.
Moving away from switch telemetry, our internal OpenStack presented itself as a great first candidate for live integration, with RabbitMQ chosen as the component to analyse due to its central role in the platform. After extracting a several days of telemetry for each queue and processing the data into a usable format, a model was trained to recognise ‘normal’ behaviour. This involved over a hundred million data points and took several hours to get to a useable level of accuracy.
Trained model in hand we were now ready for live feed from Prometheus! The system now analyses more than 20 data points for nearly 300 queues on Rabbit every 5 seconds, detecting and reporting anomalies both as they arrive and when they are fixed.
Exciting times!


