
Now that Prometheus has been installed and configured, we’ll discuss some of the Exporters.
In Prometheus, the data providers (agents) are called Exporters. You can write your own exporter/custom collector or use the prebuilt exporters which will collect data from your infrastructure and send it to Prometheus.
- Node Exporter: The Prometheus Node Exporter exposes a wide variety of hardware- and kernel-related metrics like disk usage, CPU performance, memory state, et cetera, it’s for *nix systems only.
- WMI Exporter: Prometheus exporter for Windows machines, using the WMI (Windows Management Instrumentation). It exposes the System and process metrics.
- Blackbox Exporter: Blackbox Exporter probes endpoints over HTTP, HTTPS, DNS, TCP or ICMP protocols and gives detailed metrics about the request. The most common use of the Black Box exporter is to get the status of the webpages.
- SNMP Exporter: This is an exporter that exposes information gathered from SNMP for use by the Prometheus monitoring system. The most common use of the SNMP exporter is to get the metrics from the monitor network devices like firewalls, switches and the devices which just supports snmp only.
Install the Node Exporter
Download the latest node exporter package from the official Prometheus site and unpack it.
root@demo:~# wget https://github.com/prometheus/node_exporter/releases/download/v0.18.1/node_exporter-0.18.1.linux-amd64.tar.gz

root@demo:~# tar -xvf node_exporter-0.18.1.linux-amd64.tar.gz
Copy the node export binary to /usr/local/bin:
root@demo:~# cp node_exporter-0.18.1.linux-amd64/node_exporter /usr/local/bin/
Now add a node_exporter user to run the node exporter service.
root@demo:~# useradd -rs /bin/false node_exporter
Create a node_exporter service file under systemd with the below-listed content:
root@demo:~# cat /etc/systemd/system/node_exporter.service
[Unit]

Description=Node Exporter

After=network.target
[Service]

User=node_exporter

Group=node_exporter

Type=simple

ExecStart=/usr/local/bin/node_exporter
[Install]

WantedBy=multi-user.target
Reload the system daemon and start the node exporter service.
root@demo:~# systemctl daemon-reload

root@demo:~# systemctl start node_exporter
Check the status of the node_exporter service and run the below curl request, you should see a result like this:
root@demo:~# curl --silent http://localhost:9100/metrics | head

# HELP go_gc_duration_seconds A summary of the GC invocation durations.

# TYPE go_gc_duration_seconds summary

go_gc_duration_seconds{quantile="0"} 1.102e-05

go_gc_duration_seconds{quantile="0.25"} 2.1267e-05

go_gc_duration_seconds{quantile="0.5"} 3.1807e-05

go_gc_duration_seconds{quantile="0.75"} 3.4186e-05

go_gc_duration_seconds{quantile="1"} 3.7118e-05

go_gc_duration_seconds_sum 0.000158711

go_gc_duration_seconds_count 6

# HELP go_goroutines Number of goroutines that currently exist.
Next, add the target to the Prometheus server configuration. Open the /srv/docker/prometheus/prometheus.yml and add the IP address or hostname of the machine which you want to monitor and installed the noded_exporter.
A basic file looks like this:
root@demo:/srv/docker/prometheus# cat prometheus.yml

global:

# Attach these labels to any time series or alerts when communicating with

# external systems (federation, remote storage, Alertmanager).

external_labels:

monitor: 'Demo'

scrape_configs:

# The job name is added as a label `job=` to any timeseries scraped from this config.

- job_name: 'node'

# nodeexporter

static_configs:

- targets: ['192.168.25.7:9100']
Reload the Prometheus configuration with the below curl request
curl -X POST http://localhost:9090/-/reload
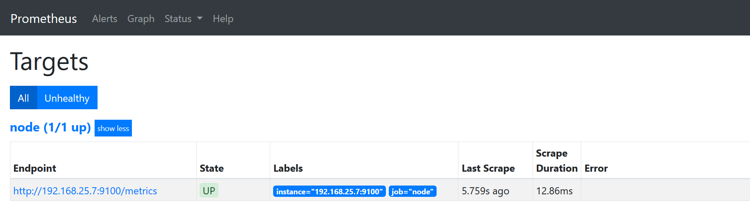
Prometheus itself has a dashboarding and alerting language, but Grafana is much nicer and has prebuilt graphs so we’re going to use that instead. You can still use the Prometheus dashboard to verify that whether node has been successfully added or not.
http://PrometheusHostIP:9090/targets
Install and configure Blackbox Exporter
For the purpose of this demo, we will use a simple shell script to configure and run the Black Box exporter. The Black Box exporter will run the same container as the Prometheus install.
Create a directory named as “blackbox-exporter” under the /srv/docker
Then create this file:
root@demo:/srv/docker/blackbox-exporter# cat blackbox.yml

modules:

http_2xx:

prober: http

http_post_2xx:

prober: http

http:

method: POST

tcp_connect:

prober: tcp

pop3s_banner:

prober: tcp

tcp:

query_response:

- expect: "^+OK"

tls: true

tls_config:

insecure_skip_verify: false

ssh_banner:

prober: tcp

tcp:

query_response:

- expect: "^SSH-2.0-"

irc_banner:

prober: tcp

tcp:

query_response:

- send: "NICK prober"

- send: "USER prober prober prober :prober"

- expect: "PING :([^ ]+)"

send: "PONG ${1}"

- expect: "^:[^ ]+ 001"

icmp:

prober: icmp
Now create and run the below script file:
root@demo:/srv/docker# cat blackbox-exporter.sh

#!/bin/bash

docker run \

-d \

--restart always \

--name blackbox-exporter \

-p 9115:9115 \

-h blackbox_exporter \

-v /srv/docker/blackbox-exporter/blackbox.yml:/etc/blackbox_exporter/config.yml \

prom/blackbox-exporter
Edit the Prometheus server configuration file to use the Blackbox exporter by adding this block:
- job_name: 'blackbox'

metrics_path: /probe

params:

module: [http_2xx]

static_configs:

- targets: [

'https://aptira.com/',

'https://google.com/',

'https://domains.aptira.com'

]

relabel_configs:

- source_labels: [__address__]

target_label: __param_target

- source_labels: [__param_target]

target_label: instance

- target_label: __address__

replacement: 172.17.0.3:9115 # Blackbox exporter's docker container IP
You can obtain the IP address of the container with help of the Docker inspect command:
root@demo:/srv/docker# docker inspect blackbox-exporter | grep "IPAddress"

"SecondaryIPAddresses": null,

"IPAddress": "172.17.0.3",

"IPAddress": "172.17.0.3",
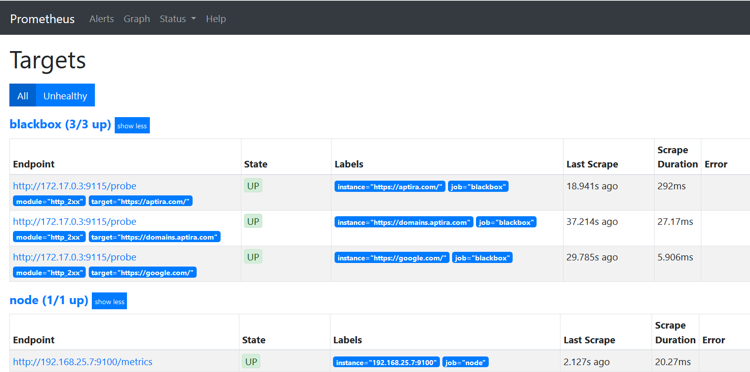
Reload the Prometheus configuration with the below curl request and check the UI:
curl -X POST http://localhost:9090/-/reload
Next, we will visualise this Prometheus data in Grafana.
Want to learn more about Monitoring with Prometheus and Grafana? Check out our 2 day Introduction to Monitoring course.