
Grafana is a graphing, dashboarding and alerting tool which can take data from a large number of sources and can send alerts to various locations such as email, PagerDuty, Slack etc. Everything in Grafana is displayed in a graph. For example, if you want to setup an alert, you need to create the graph and then add alerting rules to it.
Deployment
For the purpose of this demo, we’re going to deploy Grafana into a Docker container on the same host machine where we previously installed Prometheus and the Black Box exporter.
Create this file tree in /srv/docker:
root@demo:/srv/docker# find grafana/

grafana/

grafana/etc

grafana/etc/grafana.ini

grafana/etc/provisioning

grafana/etc/provisioning/notifiers

grafana/etc/provisioning/datasources

grafana/etc/provisioning/dashboards

grafana/data

grafana/logs
wget defaults.ini from Grafana’s GitHub repo and rename it to grafana.ini
root@demo:/srv/docker/grafana/etc# wget https://raw.githubusercontent.com/grafana/grafana/master/conf/defaults.ini
Note that – /srv/docker/grafana/data and /srv/docker/grafana/logs needs to have permissions that will allow the container to write, so you need to ensure write permissions are enabled for that directory.
Use the below script to start and configure the Grafana container:
root@demo:/srv/docker# cat grafana.sh

#!/bin/bash

docker run \

-d \

--restart always \

--name grafana \

-p 3000:3000 \

-v /srv/docker/grafana/data:/var/lib/grafana \

-v /srv/docker/grafana/etc:/etc/grafana \

-v /srv/docker/grafana/logs:/var/log/grafana \

-e "GF_SERVER_ROOT_URL=http://IPorDOMAIN" \

-e "GF_SECURITY_ADMIN_PASSWORD=REPLACEME" \

grafana/grafana
Change IPorDOMAIN with the actual host IP of your machine and REPLACEME with the admin password.
Grafana runs on port 3000. Open the port if it’s blocked by your firewall and access Grafana from any browser. After you’ve logged in, you will see a screen like this:
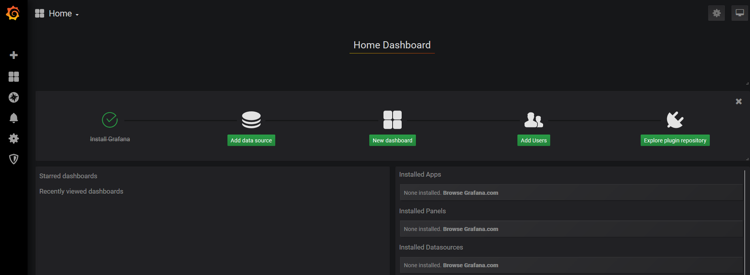
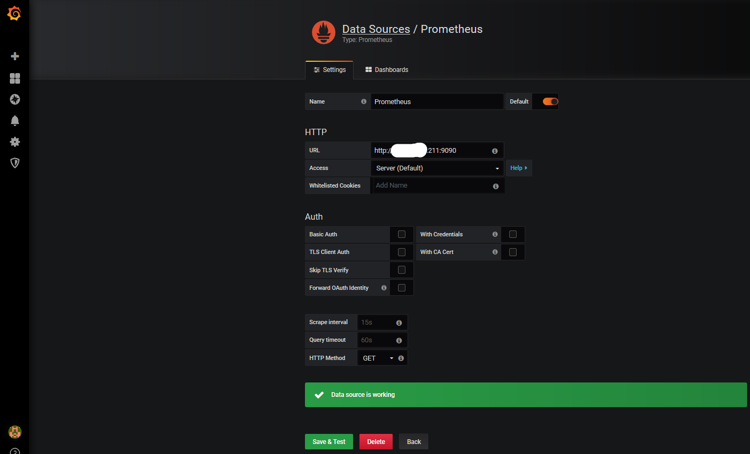
Click “Add data source” and choose data source type to Prometheus.
Provide the Prometheus url “HostIP:9090” then click Save & Test.
Next, import the dashboards to Grafana. In Grafana, you can create your own graph or use the prebuilt graphs. Prebuilt graphs are available on https://grafana.com/dashboards Search for “Node Exporter Full” or open this link https://grafana.com/dashboards/1860 and copy its ID.
On the Grafana dashboard, click the dropdown button under Home and you will see a screen like this:
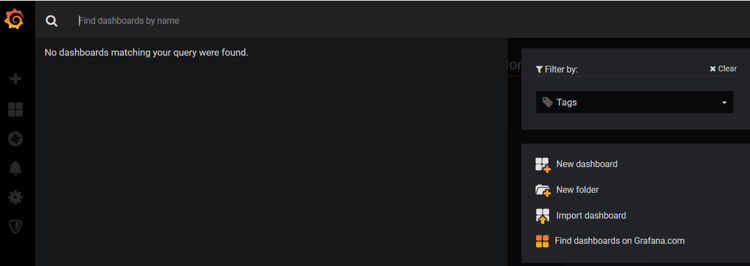
Click on “Import Dashboard” and paste that copied ID here and click the Load button.
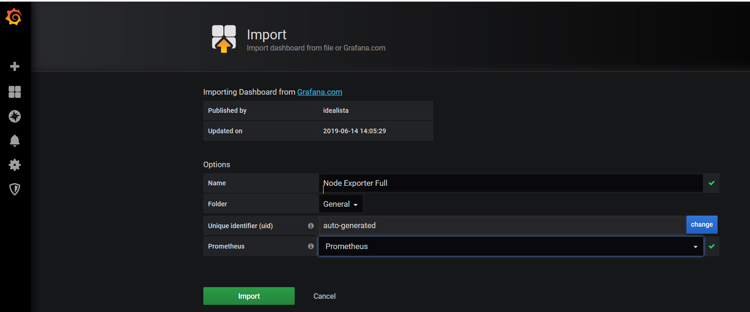
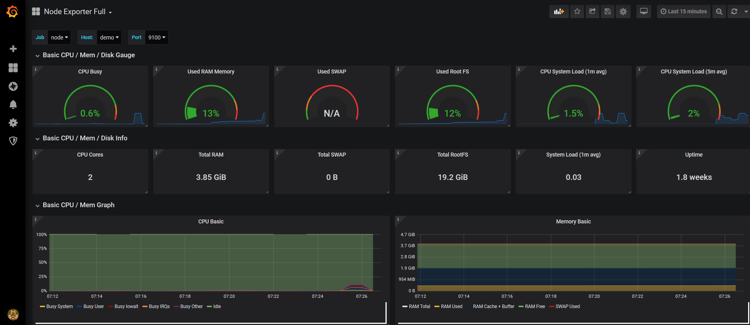
Once it’s loaded you should see a dashboard like this. It will automatically show the hosts which are configured with the Node Exporter:
You can search for other dashboards in https://grafana.com/dashboards or create your own custom dashboard.
Want to learn more about Monitoring with Prometheus and Grafana? Check out our 2 day Introduction to Monitoring course.